
Mathematics Grade 10 11 Sections52 Lessons365 Days
1.2. Graphs of Relation
Mathematics 10th Grade
Lesson Competencies
At the end of this lesson, you will be able to:
Draw graphs of linear equations like .
Identify the x-intercept and y-intercept of a line.
Draw graphs of linear inequalities like .
Identify and shade the correct region for a linear inequality.
Key Terms
x-intercept
The point where the graph of a relation crosses the x-axis. At this point, the y-coordinate is always 0.
y-intercept
The point where the graph crosses the y-axis. At this point, the x-coordinate is always 0.
Boundary Line
The line that separates the Cartesian plane into two half-planes for an inequality. It can be solid (, ) or dashed (, ).
Shaded Region
The part of the graph (a half-plane) that contains all the ordered pairs that are solutions to a linear inequality.
Video Lesson
Core Lesson: Drawing Graphs of Relations
Dear learners,
In our last lesson, we learned what relations are. Now, let’s discover how to create a picture of these relations. A graph is a visual representation that can make complex relationships much easier to understand!
Part 1: Graphing Linear Equations
A linear equation is an equation whose graph is a straight line. A common way to graph a line is by finding its intercepts.
Steps to Graph a Line Using Intercepts:
Step 1: Find the y-intercept. Set in the equation and solve for . This gives you the point .
Step 2: Find the x-intercept. Set in the equation and solve for . This gives you the point .
Step 3: Plot and Connect. Plot these two points on the Cartesian plane and draw a straight line through them.
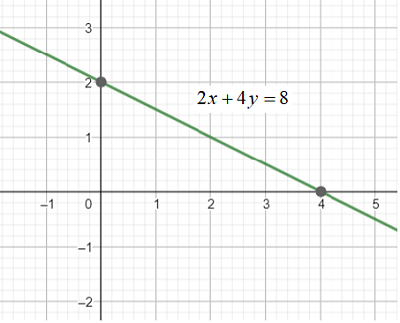
Example 1: Graph the equation .
Find y-intercept (set ):
. The point is .
Find x-intercept (set ):
. The point is .
Part 2: Graphing Linear Inequalities
Inequalities use symbols like , , , . Their graphs are not just a line, but an entire shaded region.
Steps to Graph a Linear Inequality:
Step 1: Draw the Boundary Line. Graph the line as if it were an equation.
- Use a solid line for or (the line is part of the solution).
- Use a dashed line for or (the line is not part of the solution).
Step 2: Pick a Test Point. Choose a point not on the line. The origin is usually the easiest choice.
Step 3: Test and Shade. Substitute the test point into the original inequality.
- If the result is true, shade the side of the line that contains the test point.
- If the result is false, shade the other side of the line.
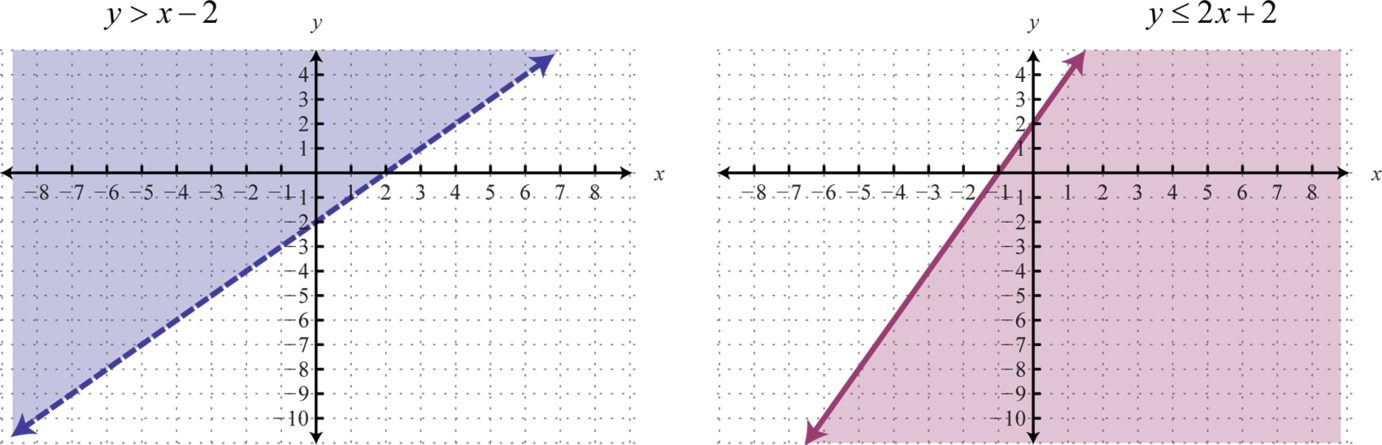
Example 2: Graph the inequality a. and b. (Ex.).
a. 1. Boundary Line: Graph . Since the symbol is , the line must be dashed. The y-intercept is and the x-intercept is .
2. Test Point: Let’s use .
3. Test and Shade: Substitute into .
. This is TRUE. So, we shade the region that includes the origin .
Part 3: More Examples
Example 3: Graph the equation .
This equation means that for any value of , is always 3. This creates a horizontal line.
The y-intercept is . There is no x-intercept because the line never crosses the x-axis.
Example 4: Graph the inequality .
1. Boundary Line: Graph . This is a vertical line. Since the symbol is , the line is solid.
2. Test Point: Use .
3. Test and Shade: Substitute into .
. This is FALSE. So, we shade the region that does NOT include the origin.
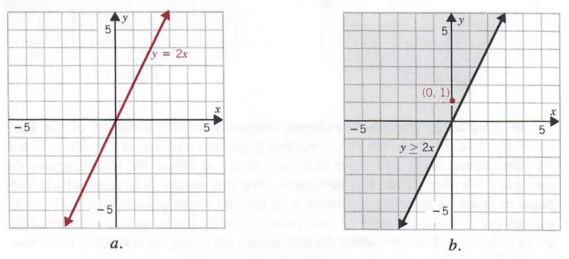
Example 5: Graph the inequality .
1. Boundary Line: Graph . The line is solid (). The y-intercept is . Since it passes through the origin, we need another point. Let’s pick , then . The second point is .
2. Test Point: We cannot use because it is on the line. Let’s pick a point not on the line, like .
3. Test and Shade: Substitute into .
. This is FALSE. So, we shade the other side of the line.
Virtual Lab: Linear Inequalities
Current Inequality
Slope-Intercept Form: y = mx + b
How to use
- Adjust Slope (m) and Intercept (b) using sliders.
- Change the inequality symbol to see how the shaded region flips.
- Note: < and > use dashed lines.
- Click anywhere on the graph to test a point!
Activity 1: Finding Intercepts
Activity 2: Lines and Shading
Activity 3: Mixed Challenge
Lesson Summary
To graph a line, find the x-intercept (set ) and the y-intercept (set ), then plot and connect them.
To graph an inequality, first draw the boundary line: solid for , and dashed for , .
Use a test point (like if it’s not on the line) to determine which half-plane to shade.
If the test point makes the inequality true, shade its region. If false, shade the other region.
Final Assessment
Competency Checklist
Check the boxes below to confirm your understanding.